
www.vizualedge.com • Press Release – updated: Jan 14, 2021
In part 1 of our 2020 MLB analysis, we looked at the correlations of important statistics and how MLB players performed on their Vizual Edge assessment. In every component of our evaluation, it’s clear that players with better Vizual Edge scores performed better in the batter’s box, which makes intuitive sense: players that see that ball better are apt to perform better in a skill largely dependent upon hand/eye coordination.
We took it a step further in Part 2 of our analysis, looking at MLB performance at various thresholds of the Edge Score and its components – analyzing what batting statistics are generated based on various Edge Score component scores. Understanding what Edge Score components are needed to succeed at the highest level in baseball is the first step that up and coming players can aim to reach to cover all bases of their own game.
Click here for 2020 MLB Analysis Part 2
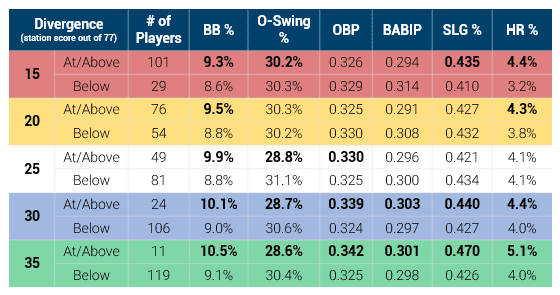
We’ve posted before about how each detail of our score correlates to different parts of baseball performance, and it’s stunning to see how players with high-end divergence scores (locating objects at a distance, such as picking the ball up out of a pitcher’s hand) had an average OPS of .812, which is an impactful and valuable offensive player.
While this again shows us that elite players tend to have elite visual skills, it should also be an encouragement to young players in knowing that these visual skills can improve with discipline and practice as part of their player development routine.
– Lukas
Follow Lukas on Twitter @LMcK_Baseball
Follow Vizual Edge on Twitter @VizualEdge